
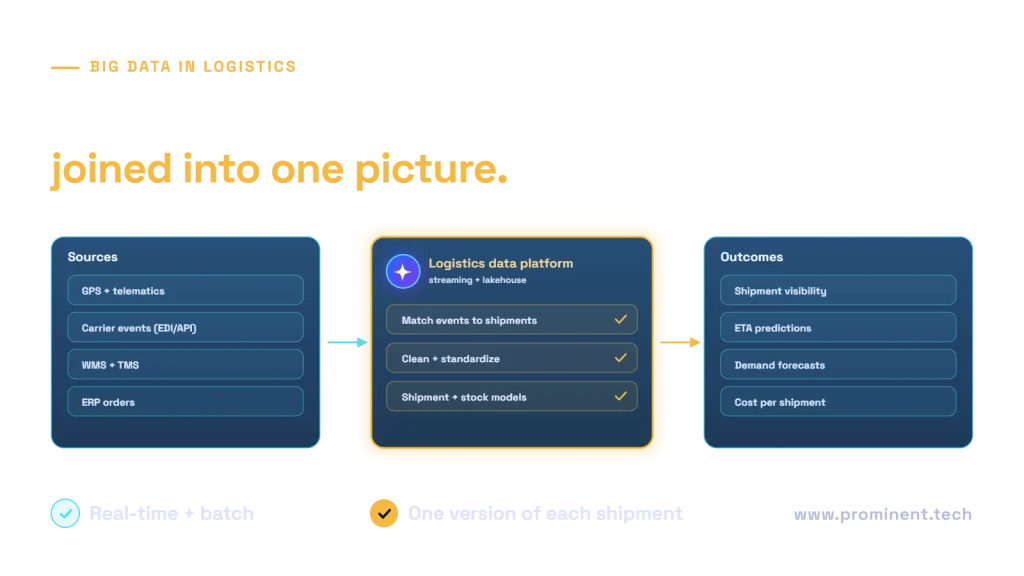
Big data in logistics means combining high-volume, fast-moving data from GPS and telematics, carrier tracking events, warehouse and transport management systems, ERP orders and external sources such as weather and traffic, to give real-time shipment visibility, more accurate ETAs, better demand and capacity forecasts, and lower cost per shipment. The main challenge is not volume but joining messy events from many partners into a reliable view of each shipment, order and stock position. A modern logistics data architecture uses streaming for live events, a lakehouse for history and analytics, and governed data models that operations, finance and customers can trust.
Key takeaways
- Shipment visibility depends on matching partner events to the right shipment reliably.
- Streaming handles live tracking; a lakehouse holds history for analytics and models.
- Data quality and master data (locations, carriers, products) decide accuracy.
- Forecasting and ETA models need years of clean history and external signals.
- Start with one visibility or cost question, then reuse the platform for more.
Data sources in logistics
| Source | Examples | Characteristics |
|---|---|---|
| Telematics and IoT | GPS, engine data, temperature sensors | High volume, continuous, location-based |
| Carrier and partner events | EDI messages, carrier APIs, tracking updates | Many formats, delays, duplicates |
| Operational systems | WMS, TMS, yard and dock systems | Structured, transactional |
| Business systems | ERP orders, invoices, contracts | Structured, master data heavy |
| External data | Weather, traffic, port congestion, holidays | Third-party, variable quality |
Big data use cases in logistics
- Real-time shipment visibility: a single view of where every shipment is, with exceptions flagged.
- ETA prediction: machine learning on history, live position, traffic and dwell times.
- Demand and capacity forecasting: planning labour, fleet and space; see AI demand forecasting.
- Route and load optimization: using historical travel times and constraints.
- Warehouse performance: pick rates, dwell times and slotting analysis.
- Fleet maintenance: predicting failures from telematics; see predictive maintenance with machine learning.
- Cost to serve: true cost per shipment, customer and lane.
- Carrier performance: on-time rates, claims and invoice accuracy.
Logistics data architecture
Live events flow through a streaming platform for alerts and visibility, and land in a lakehouse with bronze, silver and gold layers for history, analytics and machine learning. See event-driven architecture with Kafka, Service Bus and Event Grid, real-time intelligence in Microsoft Fabric and data warehouse vs data lake vs lakehouse.
Building shipment visibility
Partner events often arrive late, duplicated or with different identifiers. Matching rules, a reference list of locations and carriers, and clear handling of missing events are what make a visibility dashboard trustworthy. Industry standards such as GS1 EPCIS help partners share event data consistently.
Challenges and how to address them
| Challenge | Approach |
|---|---|
| Inconsistent partner data | Canonical event model, mapping per partner, validation on arrival |
| Duplicates and late events | Idempotent processing, event-time logic, reconciliation |
| Poor master data | Location and carrier reference data with owners |
| Data freshness | Monitoring of lag and missing feeds; see data pipeline observability |
| Connecting legacy systems | APIs and change data capture; see AI integration across ERP, CRM and supply chain |
Roadmap
- Pick one question, such as “where are delayed shipments and why?”
- Connect the minimum sources and build the canonical shipment model.
- Deliver a visibility dashboard with exception alerts.
- Add history, cost and carrier performance analytics.
- Add ETA and forecasting models once history is clean.
- Extend to agents that act on exceptions; see agentic AI in supply chain.
Common questions
How is big data used in logistics?
To provide real-time shipment visibility, predict ETAs, forecast demand and capacity, optimize routes and loads, and measure cost to serve and carrier performance.
What data do logistics companies collect?
GPS and telematics, carrier tracking events, warehouse and transport system data, ERP orders and invoices, and external data such as weather and traffic.
What architecture suits logistics data?
Streaming for live events plus a lakehouse for history and analytics, with governed shipment, location and carrier models.
Why are shipment visibility dashboards often wrong?
Usually because partner events are late, duplicated or mismatched to shipments, and master data is incomplete.
Where should a logistics company start?
With one operational question, such as delayed shipments or cost per lane, and the minimum data needed to answer it well.
Build your logistics data platform
Our data engineering team builds visibility, analytics and forecasting platforms for logistics companies.