
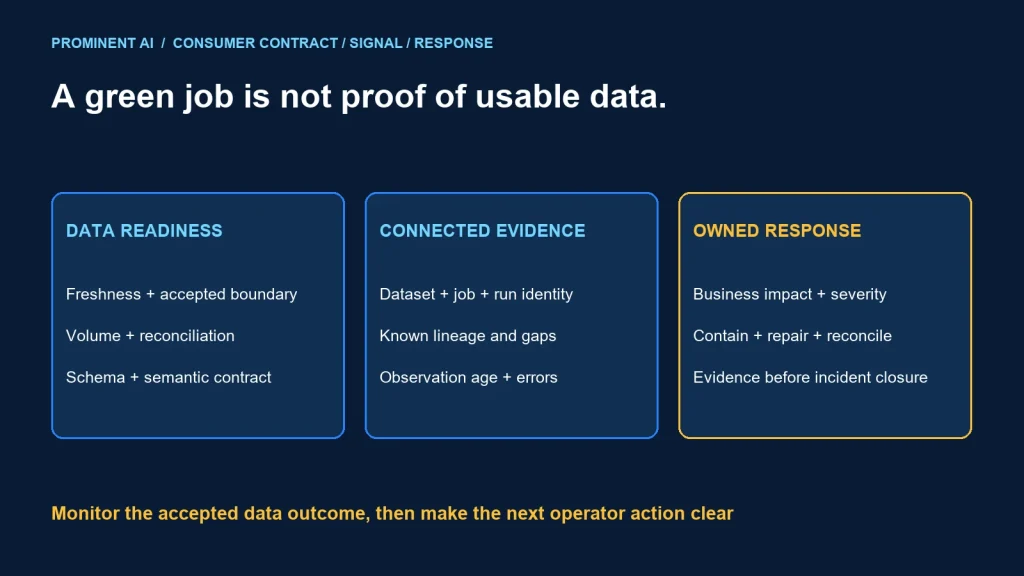
Detect broken data pipelines by observing the consumer’s data contract as well as job execution. A green task can publish stale, incomplete or structurally unexpected data. Monitor freshness, accepted volume, schema compatibility and downstream dependencies, then connect each actionable signal to an owner and a recovery decision.
Key takeaways
- Pipeline success and usable data are different outcomes.
- Define freshness from an explicit business or source boundary.
- Compare volume with expected activity and completeness, not a fixed universal threshold.
- Use lineage to investigate impact, while recording where coverage is incomplete.
Observe freshness, volume, schema and lineage
Freshness: is the required data available?
Distinguish the last successful job timestamp from the newest accepted source boundary. A job can finish without receiving the expected partition. Conversely, no new business events may be a valid quiet period rather than a failure.
Choose timestamps deliberately. Business event time, source commit time, ingestion time and target publication time answer different questions. A maximum event timestamp is vulnerable to a future-dated outlier and does not establish that all earlier records arrived.
Volume: is the expected scope complete?
Record input, accepted, rejected and pending counts at the declared grain. Compare with a source manifest or reconciliation boundary where available. Use seasonal or business-calendar expectations when activity naturally varies. A sudden count change is a prompt to investigate, not automatic proof of bad data.
Track duplicates and key coverage. Ten thousand rows can be ten thousand unique events or repeated copies of a smaller set. Reconcile important amounts and relationships alongside counts.
Schema drift: did the contract change?
Compare the observed schema with the approved contract. Record added, removed, renamed and type-changed fields, then determine their effect on consumers. An added optional field may be acceptable; a removed key or changed meaning can require a controlled migration.
Separate structural compatibility from semantic compatibility. A field can remain numeric while its unit changes. Include units, timezone interpretation, enumerated states and grain in the contract rather than monitoring only column names.
Lineage: who depends on this output?
OpenLineage’s object model distinguishes jobs, runs and datasets, with metadata facets and runtime or design-time observations. This offers a useful vocabulary for linking execution evidence to input and output datasets. Confirm what your integrations actually emit.
Lineage coverage is rarely perfect by default. Record manual exports, spreadsheets, external applications and uninstrumented jobs. A missing edge should mean “unknown dependency,” not “no downstream impact.”
A data SLO template
A service-level indicator is the measured outcome; an objective defines the accepted target and evaluation window. Agree both with the data product owner. Avoid assigning every dataset the same freshness requirement merely because the monitoring platform supports it.
| Field | Specify | Illustrative entry |
|---|---|---|
| Consumer and purpose | Who acts on the output? | Operations team reviewing accepted orders |
| Dataset/grain | What one record represents | One accepted order line |
| Required boundary | Which source period must be complete? | Approved source manifest for the reporting window |
| Indicator | How success is measured | Boundary published with reconciliation passed |
| Objective/window | Agreed target, calendar and exclusions | Fill from the actual business requirement |
| Response | Who decides what happens on breach? | Owner, escalation and publication policy |
For a scheduled output, a simple indicator can be whether each eligible publication window met its freshness and acceptance conditions. Report successful eligible windows divided by total eligible windows, while defining holidays, maintenance and missing evidence explicitly. This measures that contract, not every aspect of data quality.
For continuous data, measure lag distributions and completeness at agreed boundaries. Keep recovery time and the duration of degraded service visible. A brief return to green should not erase an unresolved historical gap.
A practical SLO dashboard specification
Use a compact dashboard that leads an operator from the affected consumer to the relevant evidence. The table below is a design specification, not a screenshot of a deployed monitoring system or a claim about current customer performance.
| Panel | Display | Operator action |
|---|---|---|
| Consumer readiness | Dataset, required boundary, accepted boundary, status | Identify affected business use |
| Freshness trend | Lag distribution and missed windows | Distinguish isolated delay from persistent backlog |
| Reconciliation | Input, accepted, rejected and pending counts | Locate missing or duplicated scope |
| Contract changes | Schema revision, compatibility decision and owner | Route a change or block publication |
| Execution health | Run state, retries, progress and errors | Open the relevant run evidence |
| Impact | Known downstream datasets and consumers | Notify owners with the affected boundary |
Keep unknown and unavailable states distinct from healthy. A monitoring collector failure must not silently display a previous green result as current health. Show the age of the observation itself.
A monitoring record template
The following JSON is a proposed internal record, not a native OpenLineage event. It intentionally uses placeholders rather than fabricated production measurements.
{
  "dataset": "orders.accepted_lines",
  "run_id": "unique-run-reference",
  "contract_revision": "approved-contract-id",
  "required_source_boundary": "manifest-or-offset-range",
  "accepted_target_boundary": "verified-publication-reference",
  "observed_at_utc": "actual-observation-time",
  "counts": {"input": null, "accepted": null, "rejected": null},
  "schema_status": "unknown-until-checked",
  "reconciliation_status": "unknown-until-checked",
  "owner": "accountable-team-reference",
  "evidence_link": "access-controlled-run-evidence"
}
Populate measurements from the system of record, not an optimistic task status. Use stable dataset identities and correlate retries with the logical publication boundary. Keep credentials, personal records and sensitive failed-row samples out of broad alert channels.
Failure triage runbook
- Confirm the signal. Check observation age and whether monitoring itself is healthy.
- Identify the affected contract. Record the dataset, expected boundary and consumer impact.
- Find the earliest broken dependency. Compare source availability, transport, transformations and publication.
- Contain unsafe output. Follow the approved hold, quarantine or degraded-service policy.
- Choose a repair. Replay, backfill, correct a mapping or deploy a compatible change with an owner.
- Reconcile. Verify keys, totals and downstream publication after repair.
- Close with evidence. Record cause, affected scope, correction and prevention work.
If source data never arrived, repeatedly restarting the target task may waste resources without repairing the cause. If the target partially committed, a blind rerun can duplicate results. Check the write and checkpoint contract before recovery.
Communicate the affected time range and outputs, not only “the pipeline failed.” A downstream team needs to know whether it can use the previous accepted version, should suspend a decision or must repair an already-consumed result.
Roll out monitoring without creating alert noise
Begin with a small set of important data products. Agree on normal business variation, run the proposed checks and review false positives with owners. Page people for actionable urgent failures; route lower-priority observations to an appropriate work queue.
Group related failures around their probable upstream incident. A single missed source file should not produce dozens of unconnected pages for every downstream table. Preserve individual impact records while reducing redundant notifications.
Exercise the runbook with synthetic missing partitions, duplicate records, incompatible schema and unavailable telemetry. Confirm that operators can find evidence and that recovery restores the right boundary. A dashboard is not complete until someone can use it during a failure.
For validation tooling, review the data quality framework comparison. For continuous and scheduled recovery, use the streaming versus batch ETL guide.
Common questions
How do you detect broken data pipelines before users notice?
Monitor the required data boundary, reconciliation, schema contract and execution health, then route actionable breaches to an owner before the consumer’s decision window.
Is a successful job enough to prove data is fresh?
No. Verify the accepted source boundary and consumer publication, not only task completion.
Does a volume anomaly always mean bad data?
No. Compare it with source completeness, business activity and calendar effects before deciding the response.
Can lineage prove there are no downstream consumers?
Only within its verified coverage. Missing or uninstrumented dependencies must remain explicit uncertainties.
What should happen when monitoring data is missing?
Show an unknown or unavailable state and investigate telemetry freshness. Do not treat missing evidence as a passing check.
Observe the data your business relies on
Bring critical datasets, consumer deadlines and recent incident examples to a review. Request a data engineering pipeline assessment to define meaningful SLOs, evidence and an owned recovery workflow.