
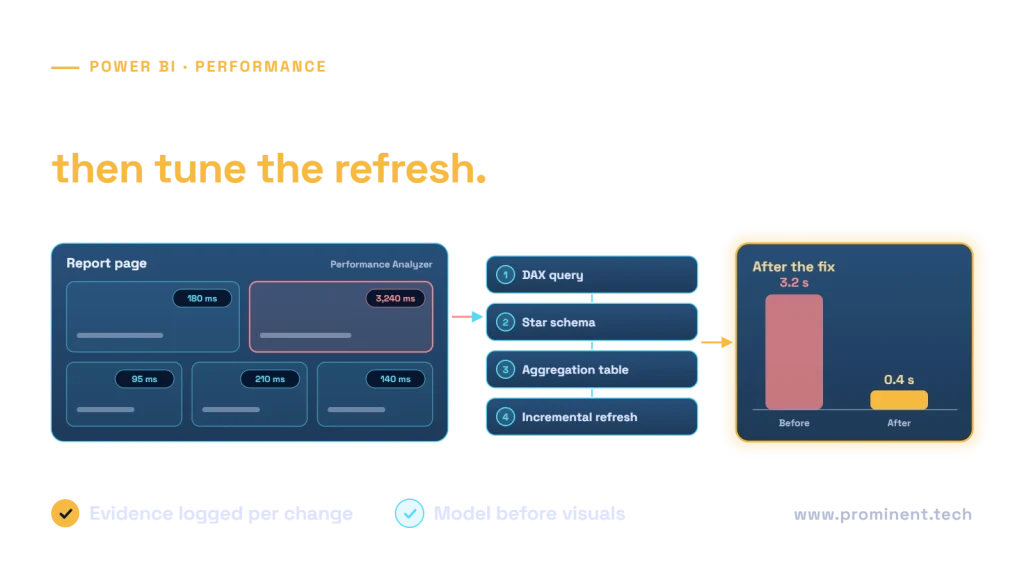
Fix a slow Power BI report by reproducing one slow interaction, measuring where time is spent and testing one change against the same accepted results. Report rendering, semantic model queries, source execution and refresh are different workloads. A DAX rewrite will not repair a slow gateway connection, and a faster refresh does not automatically make a visual render faster.
Key takeaways
- Separate interactive latency from refresh duration.
- Use a repeatable filter state, identity and workload when comparing results.
- Check grain, cardinality and relationships before adding complex measures.
- Keep correctness, access behavior and operational cost in the acceptance criteria.
Why is a Power BI report slow?
Start by naming the operation. Is the first page slow to open, a slicer slow to apply, a single visual slow to complete, or a refresh missing its window? Record whether the symptom appears in Desktop, the service, an embedded experience or several of them. The same visible delay can have different causes.
Microsoft’s optimization guide treats source systems, models, visualizations and the surrounding environment as distinct optimization layers. Use that separation to route the investigation rather than assuming every issue is a measure problem.
| Symptom | First evidence | Next investigation |
|---|---|---|
| One visual is slow | Visual timing and its query | Query shape, filters and display work |
| Every interaction slows at busy times | Concurrent workload and environment metrics | Shared resource pressure and source/gateway behavior |
| Desktop is acceptable, service is slow | Comparable identity, data and filter state | Environment, network and execution differences |
| Refresh misses its window | Refresh history and source/transform timings | Extraction, transformation, loading and contention |
| Totals are wrong after a speed change | Reconciliation and access tests | Reject the change until semantics are corrected |
A diagnostic runbook for slow reports
- Define the contract. Identify the report, model revision, storage mode, user role and interaction. State the business result that must remain unchanged.
- Reproduce the symptom. Use a known page and filter state. Capture first-load and repeat-interaction runs separately.
- Record visual timings. In a supported editing context, use Performance Analyzer and reproduce the interaction.
- Inspect the expensive path. Separate query work from visual display and waiting/background work.
- Form one hypothesis. For example, an unnecessarily detailed visual requests too many groups.
- Test one bounded change. Compare the same filters, identity and data revision.
- Validate results. Reconcile measures and verify intended access before releasing.
Performance Analyzer documentation describes recording interactions, viewing visual durations and copying a visual’s DAX query for inspection. Its timing categories include query, display and other work. Durations can include queueing, so they should not be treated as independent CPU measurements or blindly added into a page-time estimate.
A copied query is a diagnostic artifact. Keep the filter context and access assumptions with it. A query replayed under a different identity, cache condition or model revision is not a controlled comparison.
Model design and DAX optimization
Check cardinality and relationships
Inspect high-cardinality fields, unused columns and relationship paths. A long unique text field used only for drill-through may not belong in every summary interaction. Evaluate removal or separation only after checking actual consumers and detail requirements.
Confirm that fact tables have a declared grain and dimension keys behave as intended. Unexpected many-to-many relationships or unnecessary bidirectional filtering can complicate both results and execution. Do not change relationship direction simply because a visual becomes faster; test the business interpretation and any row-level security dependencies.
Measure a DAX change in context
Find the measures used by the slow visual and test their behavior under representative filters. Review repeated calculations, unnecessary iteration and expressions that materialize more detail than required. Variables can improve clarity and avoid some repeated expression work, but they are not a universal performance guarantee.
Preserve semantics when simplifying measures. A ratio of totals differs from an average of row ratios. Blank handling, inactive relationships, subtotal behavior and time context can change after an apparently harmless rewrite. Keep a compact set of expected results for ordinary, empty, boundary and restricted-access cases.
For a reusable modeling foundation, review the dimensional modeling comparison. A report should not rely on an end user remembering how to compensate for duplicated facts.
Visual density and aggregation tables
Look at the information requested by the page. A visual with many categories, expensive custom rendering or unnecessary detail can be costly even when the source is healthy. Test fewer simultaneous visuals, an intentional summary level and a drill-through path for detail. Retain the user’s ability to answer the business question.
Review cross-filtering interactions. An unrelated visual should not rerun merely because a slicer changes unless that interaction is useful. Compare the page as a whole after changes; optimizing one visual while causing additional work elsewhere is not a clear improvement.
User-defined aggregation documentation explains how supported aggregation mappings can serve queries over large DirectQuery models. Treat an aggregation as an additional maintained data product: define its grain, mappings and refresh relationship to the detail data. Verify that representative queries actually use the intended path.
Test questions the aggregation cannot answer and confirm the fallback behaves acceptably. Distinct counts, detail drill-through and access rules need deliberate validation. Do not accept a faster aggregate that loses required detail or changes totals.
Investigating refresh bottlenecks
Refresh has its own critical path: source extraction, transformation, transfer, model processing and scheduling conditions. Capture available history and logs before changing schedules or increasing resources. Record failed attempts and retries as well as successful runs.
Inspect the source queries and transformation boundary. Confirm where filters and transformations execute, rather than assuming a step folds to the source. Test the actual connector and supported query plan. Reducing unnecessary rows and columns early can be useful, but the output contract must remain intact.
Consider incremental processing only when the source, model and supported configuration can identify the right change range. Updates to old records, deletions, late data and timezone boundaries can invalidate a simple “new rows only” assumption. Test a correction outside the newest partition before relying on an incremental strategy.
If a gateway or shared source is involved, examine availability and workload contention with its owner. Staggering loads may help a demonstrated contention problem; it does not fix inefficient transformations by itself. Keep freshness requirements and downstream report windows explicit.
A diagnostic log and release checklist
The following is a fictional investigation record format, not a measured customer result or an exact native Power BI export schema. Replace placeholders with actual evidence.
case: report-order-summary
model_revision: approved-revision-id
identity_context: representative-role
interaction: set agreed date range and region
cache_condition: record first load or repeat interaction
observation: record visual/query/display durations
hypothesis: selected visual requests unnecessary detail
change: reduce grouping to approved business grain
result: record repeated timings and variability
correctness: reconcile totals, blanks and drill-through
access: verify intended restricted-user results
decision: accept / reject / investigate further
Keep the environment and data revision with every comparison. If another workload was active during one run, record that limitation. Do not publish a percentage improvement from one favorable timing.
- Reproduce the original symptom under the agreed conditions.
- Keep baseline evidence and a rollback version.
- Validate measures, totals, filters and detail navigation.
- Check access behavior under representative roles.
- Compare interactive latency and refresh separately.
- Review maintenance effort and resource cost.
- Observe the released workload through its next relevant operating cycle.
For upstream performance issues, use the PySpark tuning runbook. For data correctness, align the report contract with the data quality checks.
Common questions
Why is a Power BI report slow and how can you fix it?
Reproduce a specific interaction, identify whether time is spent in queries, rendering or the environment, then test a targeted change while preserving results and access behavior.
Will rewriting DAX fix every slow dashboard?
No. Source latency, model design, visual rendering, gateway conditions and shared workloads can also be responsible.
Does a faster refresh mean faster report interactions?
Not necessarily. Refresh and interactive queries are different workloads and need separate measurements.
Should every report use aggregation tables?
No. Use them when supported mappings and repeated workload patterns justify the added refresh and maintenance responsibilities.
How should an optimization be accepted?
Compare repeated runs under documented conditions, reconcile business results and test access, refresh and operational behavior before release.
Turn slow-report complaints into a testable improvement plan
Bring the report, model revision, slow interaction and available timings to a review. Request a data engineering pipeline assessment to identify the bottleneck and validate a focused change.