
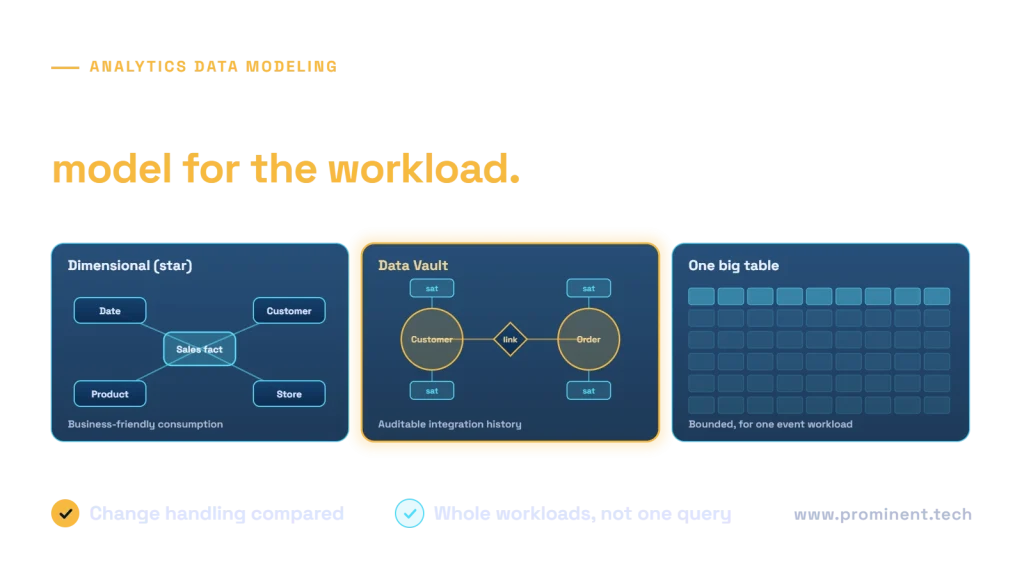
Use dimensional modeling for a shared analytical consumption model, Data Vault when historical integration across changing sources justifies a dedicated integration layer, and a one big table for a bounded workload with a clear grain. These patterns can coexist. The useful decision is where each model belongs, who maintains its business rules and how changes reach consumers safely.
Key takeaways
- Define what one row represents before choosing a schema.
- Separate historical source integration from business-facing metrics.
- Test late data, corrections and changing attributes, not only a dashboard query.
- A wide table removes some joins but can introduce duplicated measures and costly rebuilds.
Dimensional modeling vs Data Vault vs one big table
Dimensional modeling: facts and descriptive context
A dimensional model organizes measurable events into fact tables and descriptive context into dimensions. A star schema connects these through defined keys. Microsoft’s Fabric guidance recommends star schemas for analytical warehouse workloads and explains the roles of facts and dimensions.
The important design contract is the grain: what one fact row represents. Kimball’s grain guidance explains why mixing measurement events can produce incorrect aggregates. A transaction-line table and a daily balance table should not be combined casually just because both contain an amount column.
Data Vault: historical integration
Data Vault separates business keys, relationships and descriptive history into hubs, links and satellites. The Databricks introduction describes this structure and shows how it can feed downstream analytical marts. It is not a requirement to expose the vault directly to every reporting user.
Consider it when source onboarding, historical reconstruction and changing relationships create substantial integration work. The extra tables, loading conventions and temporal joins need engineering ownership. A vault does not automatically settle conflicting business definitions or provide a ready-made finance metric.
One big table: a deliberately bounded serving model
A one big table, or OBT, denormalizes selected attributes and measures into a wide analytical table. It can simplify a particular query path, export or feature dataset. Declare its row grain, historical interpretation, refresh policy and permitted uses.
Do not interpret “one” as a mandate to put every business process into a single enterprise table. Flattening independent one-to-many relationships can multiply rows. Repeated header values can then be summed incorrectly even when the SQL executes quickly.
Architecture 1: finance integration with dimensional consumption
This illustrative design separates preserved source history from approved reporting rules. A team with stable, well-understood sources may use a simpler integration layer; the vault is a candidate only where its benefits justify its operating cost.
ERP A ledger + ERP B ledger + account mappings
                 ↓
Source-aligned landing + ingestion/replay controls
                 ↓
Historical integration (Data Vault candidate)
Business keys | relationships | descriptive history
                 ↓
Approved mapping + currency + period rules
                 ↓
Ledger-line fact → account / entity / date dimensions
                 ↓
Governed semantic measures → finance reportsDefine a ledger fact at an agreed posting-line grain. Record entity, account, posting date, currency and the source reference needed for reconciliation. Treat closing balances, movements and exchange rates according to their own grains and aggregation rules. A sum that is meaningful across accounts may not be meaningful across time or currencies.
If an account changes reporting group, decide whether a report should show the group at transaction time or today’s group. Those are different questions. An effective-dated dimension can support historical classification, while a separate current mapping supports restatement. Make the chosen interpretation visible to consumers.
Test source-to-target totals at the agreed boundary. Reconciliation should identify excluded, rejected and adjusted records rather than hiding differences in an unexplained aggregate. Preserve approval ownership for mapping changes and period restatements.
Architecture 2: event analytics with a bounded wide table
Application events + versioned user/product context
                 ↓
Validated event store (one row per accepted event)
                 ↓
Identity resolution + event-time enrichment
           ↙                         ↘
Event-grain wide table          Reusable fact + dimensions
Selected exploration           Shared recurring BI metrics
           ↓                         ↓
Bounded analyst workload Governed semantic modelA clickstream team might build a table with one row per accepted event and selected product, campaign and device attributes. This can reduce repeated enrichment work for a specific analysis. Keep a stable event identifier and define what happens when an event is duplicated, arrives late or references an unresolved entity.
A user can have several subscriptions and a session several events. Joining subscriptions directly onto each event can duplicate events. Choose a justified relationship, an allocation rule or a separate bridge instead of silently increasing the row count.
Keep sensitive attributes out of a widely shared OBT unless the access design requires them. Denormalization copies context into more places, so deletion, access and retention requirements must cover those copies as well as the original dimension.
How the models handle change
| Change | Dimensional model | Data Vault layer | Wide serving table |
|---|---|---|---|
| Customer attribute changes | Choose current overwrite or effective-dated history | Preserve descriptive history using the adopted conventions | Decide whether old rows retain context or are rebuilt |
| New source system | Map keys and definitions into conformed dimensions | Add source integration with explicit identity rules | Extend the build and assess all affected columns |
| Late event or correction | Resolve keys and recalculate affected facts/measures | Preserve arrival and business-time meaning | Repair affected partitions and downstream extracts |
| New business metric | Define measure against an appropriate fact grain | Apply business interpretation in a suitable downstream layer | Check that available grain supports the measure |
Load time and business-effective time are different. A record received today may describe a change effective last month. Define which timeline an “as of” report uses. Neither an append-only history nor a dimension version alone resolves that question without an explicit temporal contract.
Compare complete workloads, not a single SELECT
Run equivalent queries over equivalent accepted data. Include repeated dashboards, new questions, daily ingestion, historical correction and a new-source change. Record build time, query latency, concurrency, storage, maintenance effort and correctness.
| Workload | What to compare | Acceptance evidence |
|---|---|---|
| Recurring finance dashboard | Star model and curated wide output | Same accepted measures and access behavior |
| Historical reconstruction | Source history and temporal interpretation | Reproduce an agreed past state |
| New event exploration | Wide table convenience and reusable model flexibility | Answer a new question without invalid joins |
| Correction and replay | Repair scope and dependent outputs | No duplicate facts; reconciled results |
| Source onboarding | Identity mapping and transformation changes | Documented lineage and stable consumer contract |
No benchmark results are claimed here. Performance depends on engine, data distribution, physical layout, caching and concurrency. Fewer joins do not establish lower total cost if the serving table requires large repeated rebuilds or extensive duplicated logic.
A selection matrix for the Head of Data
| Main requirement | Starting candidate | Condition to prove |
|---|---|---|
| Reusable BI measures across teams | Dimensional consumption model | Consistent grains, dimensions and metric ownership |
| Complex historical integration across changing sources | Data Vault plus consumption models | Benefits exceed added loading and temporal complexity |
| Specific stable analysis or export | Bounded wide serving table | Grain, refresh and duplication controls remain clear |
| Several needs together | Layered combination | Each layer has a distinct purpose and owner |
Start with a thin end-to-end slice. Write the grain and temporal rules, load representative source changes, reconcile outputs and ask an analyst to use the model. Expand after correctness and maintenance are demonstrated. Avoid adding layers solely to match an architecture diagram.
For ingestion choices, review the CDC architecture guide. Use the data quality framework comparison to plan validation around the model’s contract.
Common questions
When should analytics teams use Data Vault instead of star schemas?
Consider Data Vault for a historical integration layer when changing sources and traceability justify it. Star schemas can still provide the downstream analytical consumption layer.
Is one big table always faster?
No. Test the full workload, including builds, corrections, concurrency and storage. Query shape and the engine’s execution plan matter.
Can Data Vault and dimensional modeling coexist?
Yes. A historical integration model can feed dimensional marts with approved business definitions and measures.
What is the biggest risk when flattening data?
Uncontrolled one-to-many joins can duplicate rows and measures. Declare the grain and test cardinality before accepting the output.
Which model should a small analytics team start with?
Start with the simplest model that preserves the required grain, history and consumer contract. Add a separate integration pattern only when demonstrated needs justify its ownership cost.
Choose a model your team can explain and maintain
Bring source-change examples, priority queries and reconciliation requirements to a review. Request a data engineering pipeline assessment to define an appropriate integration and analytics serving design.