
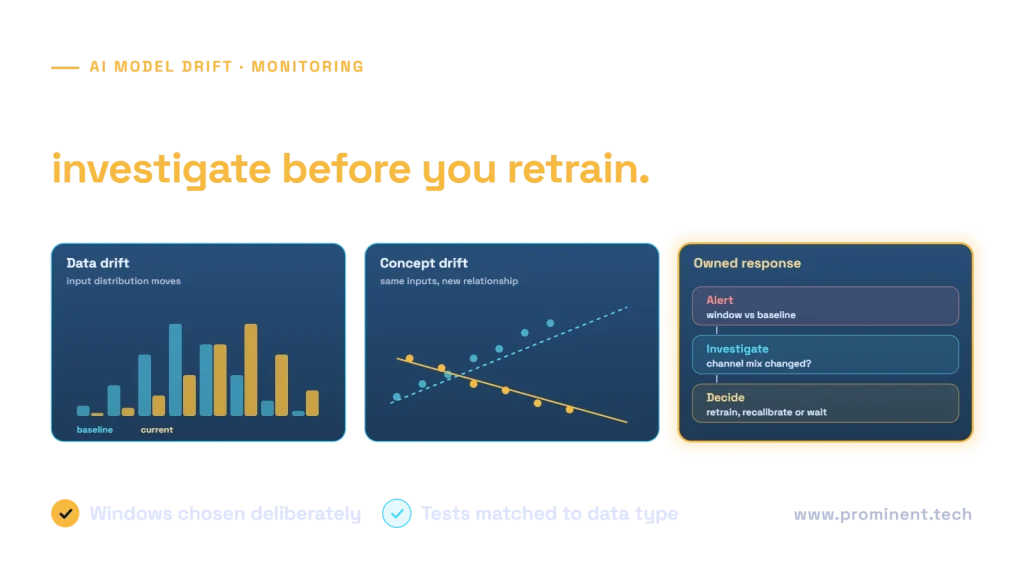
Data drift is a change in the input distribution; concept drift is a change in the relationship between inputs and the target outcome. Input drift can signal a need to investigate, but it does not prove that model accuracy declined. Concept drift can occur even when individual input distributions look stable. Monitor data, predictions, task performance and operating context together.
This guide provides a monitoring architecture, baseline-window choices, a runnable distribution-distance example and response decisions. The example uses declared counts, not production traffic or a trained model benchmark.
Data drift vs concept drift vs performance decline
| Signal | Meaning | Fictional example | What it does not prove |
|---|---|---|---|
| Input or data drift | The distribution of X changes | More requests arrive by phone than web | That predictions are less accurate |
| Concept drift | The relationship P(Y|X) changes | A process change alters which incident symptoms imply a component failure | That every input marginal must change |
| Prediction drift | The distribution of model outputs changes | More cases receive a high-risk score | Whether the new outputs are wrong |
| Performance decline | Evaluated task quality worsens | Reviewed outcomes show more missed relevant cases | That drift is the only cause |
Broken preprocessing, stale features, label delays or deployment changes can also reduce performance. Investigate those causes instead of labeling every production regression “concept drift.” Azure Machine Learning monitoring guidance distinguishes multiple monitoring signals that can be examined together.
A monitoring architecture with an owned response
Production input + prediction + configuration references
    → approved telemetry and data-quality checks
    → comparable baseline / current windows
    → drift and operating signals
    → delayed labels or reviewed task outcomes
    → triage by model and source owners
    → repair, investigate or evaluate retraining
    → controlled validation and deployment
Keep data collection scoped to the monitoring purpose and access policy. Record schema, feature processing and model versions. A distribution change caused by a renamed category should not be mistaken for a new customer behavior pattern.
Assign each alert an owner, a severity interpretation and a response route. A dashboard without an investigation process does not maintain the model.
Choose baseline and current windows deliberately
A training baseline can expose differences from the original development data. A recent production baseline can highlight changes since the last stable period. Neither is universally correct. Define what question the comparison is intended to answer.
Compare like with like: weekday with weekday where relevant, consistent business segments, equivalent instrumentation and sufficient observations. Seasonal shifts may be expected rather than harmful. Preserve important slices so an overall population mix does not hide a problem in one group.
Fixed and rolling baselines
A fixed baseline keeps long-term movement visible but can become obsolete. A rolling baseline adapts to recent data but can normalize a gradual problem. Consider both views where they answer distinct questions, with documented refresh rules rather than silent baseline replacement.
Record window sizes and missingness. A tiny sample can produce unstable conclusions, while very large samples can make small, operationally unimportant changes statistically detectable. Use effect size and business relevance alongside significance.
Select tests by data type and the question
| Data | Possible measure | Interpretation caution |
|---|---|---|
| Numerical feature | Distribution test or distance such as KS or Wasserstein | Check assumptions, scale and sample size |
| Categorical feature | Frequency comparison, suitable test or probability distance | Handle rare and new categories explicitly |
| Missing values and schema | Rates and contract checks | A pipeline fault may look like drift |
| Predictions | Output distribution and slice rates | Changed predictions are not automatically incorrect |
| Labeled outcomes | Task performance by period and slice | Account for delayed and selectively observed labels |
Evidently’s archived drift-algorithm reference (0.6.7 and earlier) documents choices that depend on feature type and data volume. Its defaults are an implementation choice, not a universal threshold for every application. Confirm the current library version and selected test in your monitoring configuration.
Testing many features repeatedly creates alert-volume and multiple-comparison concerns. Calibrate thresholds and persistence rules against a stable historical period, review false alarms and avoid automatically retraining because one p-value crosses a generic cutoff.
Worked example: a changed channel mix
The following standard-library Python function calculates total variation distance between two categorical count maps. It is a descriptive distance, not a p-value, concept-drift detector or model-performance evaluation.
"""Declared categorical distribution fixtures, not a statistical significance test."""
def tvd(a,b):
    if not a or not b or min(a.values())<0 or min(b.values())<0:
        raise ValueError('Use nonnegative, nonempty count maps')
    na,nb=sum(a.values()),sum(b.values())
    if not na or not nb: raise ValueError('Each window needs observations')
    return 0.5*sum(abs(a.get(k,0)/na-b.get(k,0)/nb) for k in set(a)|set(b))

baseline={'web':80,'phone':20}
changed={'web':50,'phone':50}
assert abs(tvd(baseline,changed)-0.3)<1e-9
assert tvd(baseline,baseline)==0
print({'same_window_distance':tvd(baseline,baseline),
       'changed_channel_mix_distance':tvd(baseline,changed)})
The local run returns 0 for the identical fixture and 0.3 for a shift from 80% web / 20% phone to 50% / 50%. That establishes the declared distribution arithmetic only. It says nothing about whether a model’s predictions are now wrong.
To investigate impact, examine task performance for web and phone cases, data quality and any process change. If both channels remain well served, the mix change may require capacity planning rather than retraining. If the phone slice performs poorly, address that observed weakness and validate the proposed remedy.
Use drift alerts to start diagnosis
| Observation | First investigation | Possible response |
|---|---|---|
| Schema or missingness changes | Instrumentation and preprocessing | Repair the pipeline |
| Input mix changes, quality stable | Business and seasonal explanation | Monitor, adjust capacity or revise baseline deliberately |
| Quality declines with reviewed labels | Data, process and model failure slices | Evaluate repair, recalibration or retraining |
| New unsupported population | Coverage and risk | Constrain use or route for review while evaluating |
| External model configuration changes | Release and behavior comparison | Re-evaluate, roll back if possible or mitigate |
Retraining requires suitable data and held-out validation, not merely a trigger. Compare the new candidate with the current model under consistent task criteria, inspect regression slices and deploy through a controlled release. Keep a rollback or forward-repair plan.
Delayed labels need careful interpretation
If outcomes arrive weeks later, current quality may be unknown rather than stable. Monitor early proxies, but label them as proxies. Avoid comparing mature baseline labels with incomplete recent labels as though they were equivalent.
LLM applications have additional change sources
For an LLM application, behavior can change because of prompts, provider models, retrieval sources, tool contracts or user task mix. Input drift measures alone cannot isolate these causes. Version the full configuration and keep representative regression cases.
A RAG answer failure caused by a missing document is not necessarily a model-drift problem. Use the retrieval troubleshooting runbook. Use the LLMOps release process to distinguish planned changes from unexpected regressions.
Common questions
What is the difference between data drift and concept drift?
Data drift changes the input distribution. Concept drift changes the relationship between inputs and the target outcome. Either can matter, but input changes alone do not prove concept drift.
Does detected drift mean accuracy has dropped?
No. Evaluate labeled outcomes or reviewed task results where possible. Drift is a signal to investigate; performance impact depends on the model and affected population.
Should a drift alert automatically retrain a model?
Not by default. First rule out pipeline faults, expected seasonality and harmless mix changes. Any retrained candidate still needs data-quality checks and held-out validation.
Which baseline should I use?
Choose a baseline that answers the monitoring question, such as training data or a reviewed stable production period. Document window size, slices and refresh rules, and account for seasonality.
Can concept drift occur without obvious input drift?
Yes. The relationship between features and outcomes can change while individual input distributions remain similar. Outcome evaluation is important when labels become available.
Connect monitoring to a tested response
Use the application testing playbook for behavior changes. To review monitoring signals, evaluation and release ownership, discuss your production AI reliability roadmap.