
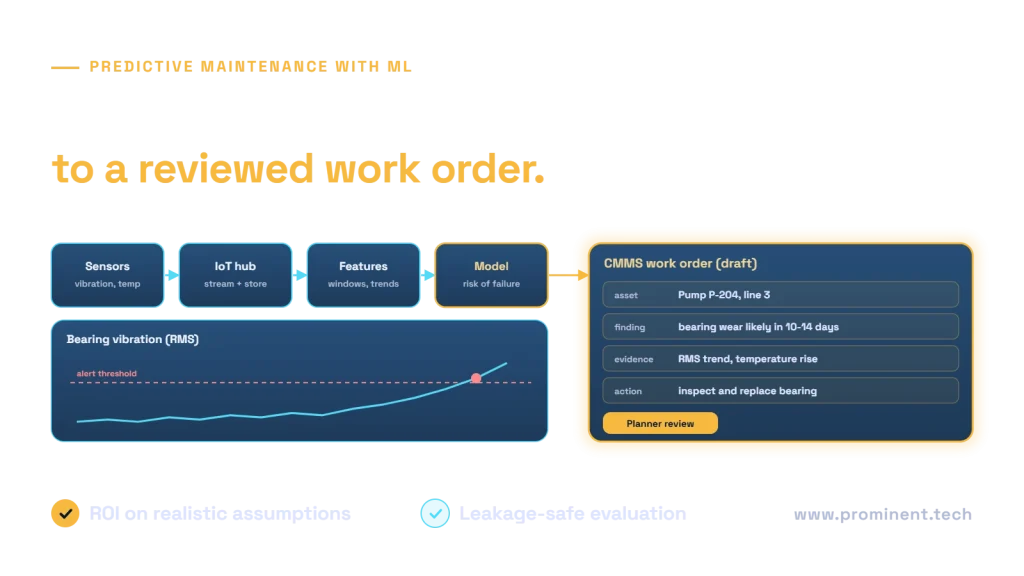
Predictive maintenance uses machine learning and operational data to estimate developing equipment problems so a maintenance team can decide what to inspect or repair. It requires more than a sensor dashboard: reliable asset identity, time-aware data, meaningful failure labels, a tested model and a work-order process. An anomaly is not automatically a failure, and a remaining-useful-life estimate is not a guarantee of safe operation.
The commercial question is whether a signal enables a useful intervention. An alert that arrives after damage, or cannot be acted on because a spare part is unavailable, has little practical value. Start with a known failure mode, maintenance owner and intervention window. Keep safety interlocks and certified control systems independent of experimental prediction. This guide explains the path from telemetry to reviewed maintenance action without promising an arbitrary accuracy percentage.
Key takeaways
- Distinguish condition monitoring, anomaly detection, failure prediction and remaining useful life.
- Use event timestamps, operating context and quality flags—not sensor values alone.
- Split evaluation by time and asset before creating overlapping windows.
- Compare against the existing maintenance policy, including false-alert workload.
- Integrate with the CMMS and record what the technician actually found.
- Include instrumentation, review, spares and model maintenance in ROI.
Predictive versus preventive and condition-based maintenance
| Approach | Trigger | Appropriate use | Limitation |
|---|---|---|---|
| Reactive | A fault or failure occurs | Low-consequence, inexpensive items | Unplanned interruption |
| Preventive | Time or usage interval | Established wear schedules | May service healthy equipment |
| Condition-based | Measured condition crosses a rule | Known measurable limits | A threshold may not predict future failure |
| Predictive | Estimated future risk or degradation | Actionable failure modes with data | Requires validation and monitoring |
| Prescriptive | Recommended action under constraints | Decision support using risk and cost | Needs a trustworthy decision model and authority |
These approaches can coexist. A plant may retain mandatory inspections, use thresholds for critical vibration limits and trial a model for earlier bearing-risk signals. The goal is not to eliminate preventive maintenance indiscriminately. A model must demonstrate useful lead time and acceptable risk for a specific asset class before it changes the maintenance policy.
Start with the maintenance decision and available evidence
Define the failure mode, consequence, warning horizon and intervention. “Predict machine failure” is too broad: a compressor seal problem and an electrical control fault have different signatures and remedies. Ask whether a technician can inspect the suspected component, whether a spare is available and how much notice is required. Specify which alerts remain advisory and who can authorize a work order or shutdown.
Audit historians, PLC/SCADA feeds, maintenance records, operating schedules and CMMS events. Failure labels are often inconsistent: a work order may describe a symptom rather than a confirmed component failure. Record inspection results, replaced parts, cause codes and whether equipment returned to normal. Scheduled maintenance can censor the outcome: the component might have failed later, but the observation ended when it was replaced.
| Data | Examples | Common quality problem |
|---|---|---|
| Telemetry | Vibration RMS, temperature, current, pressure | Missing readings and unit changes |
| Operating context | Load, speed, mode, ambient conditions | Normal regime changes look anomalous |
| Asset metadata | Component, model, installation and service dates | Incorrect or changing identifiers |
| Maintenance history | Inspection, repair, replacement and findings | Work-order closure is mistaken for failure time |
| Production context | Batches, shifts and downtime | Planned stops mislabeled as faults |
An IoT architecture from sensor to work order

At the edge, buffer data during connectivity loss, authenticate devices and preserve event time. Ingestion must handle late, repeated and out-of-order messages. Validate ranges, units and sensor health before calculating features. Keep raw observations, transformations and feature definitions versioned so an alert can be reproduced. A broken sensor should create a data-quality exception rather than a confident equipment diagnosis.
Separate offline model development from online or scheduled inference. Training uses authorized historical snapshots and verified outcomes, followed by evaluation and a controlled model registry. Inference uses the approved feature contract and model version. A decision layer combines the signal with operating rules, availability and engineer judgment before a CMMS task is created. Feedback should update the evidence base, not automatically promote a newly retrained model.

Microsoft’s Fabric predictive maintenance architecture illustrates a possible real-time intelligence pattern. Eventstreams, Eventhouse and OneLake can support selected ingestion and analysis needs; Azure Machine Learning can support model lifecycle work. These services are options, not a requirement for every machine. Confirm supported connectors, regions and workloads for the selected implementation.
An alternative AWS pattern can use IoT Core, durable storage and a selected SageMaker AI model with integration into maintenance systems. The AWS predictive maintenance with SAP solution documentation is a reference pattern, not proof of performance for a different fleet. A small estate may need batch scoring before it needs an elaborate streaming stack.
Choose models by task, labels and operating constraints
| Model family | Suitable task | What to verify |
|---|---|---|
| Logistic regression | Interpretable failure-risk baseline | Nonlinear effects and calibrated probabilities |
| Random forests or boosted trees | Tabular risk with mixed engineered features | Time leakage, imbalance and regime drift |
| Isolation Forest | Unusual multivariate behavior | Anomaly does not imply a known failure |
| One-class SVM | A well-defined normal operating envelope | Scaling, data volume and regime coverage |
| Autoencoder | Reconstruction-based anomalies | Healthy training data and error interpretation |
| LSTM, GRU or TCN | Temporal patterns in sequences | Sufficient sequences, masking and inference cost |
| Survival models | Time-to-event with censored observations | Censoring assumptions and changing hazards |
| RUL regression | Remaining life with appropriate histories | Run-to-failure evidence and uncertainty |
Use a simple baseline first. A condition threshold or logistic model can reveal whether the data supports the decision before a complex sequence model is built. Deep learning is not inherently superior when failures are rare and labels are weak. Models trained on one machine type may need adaptation or separate validation for another. Choose complexity only when it improves a meaningful operating measure on an independent test.
Anomaly detection, failure risk and RUL are different outputs
An anomaly score measures departure from a learned pattern. A failure-risk model estimates a specified event within a defined horizon. RUL estimates time or usage remaining until a defined endpoint. They require different labels and evaluation methods. Do not display an arbitrary anomaly score as “80% chance of failure,” or treat an estimated RUL as a safety guarantee. Show the meaning, time horizon and limitations beside the result.
Features and a coherent scoring workflow
# Synthetic telemetry contract; no real asset or production connection.
{
  "asset_id": "DEMO-PUMP-01",
  "event_time_utc": "2026-01-01T10:00:00Z",
  "sensor_id": "bearing-vibration",
  "vibration_rms_mm_s": 2.4,
  "temperature_c": 57.0,
  "operating_mode": "steady_load",
  "quality_flag": "valid"
}
Candidate features include rolling vibration statistics, temperature trends, current imbalance, time since service and the operating regime. Set window boundaries using only information available before the prediction cutoff. Normalize units and retain missingness indicators where meaningful. Frequency-domain features require an adequate sampling rate and suitable signal processing; low-frequency summaries cannot recreate information that was never captured.
# Design pseudocode, not a deployed safety or control system.
for batch in telemetry_batches:
    events = validate_identity_units_and_event_time(batch)
    events = remove_exact_duplicates(events)
    for asset_window in build_past_only_windows(events):
        if not data_quality_passes(asset_window):
            record_data_quality_exception(asset_window.asset_id)
            continue
        features = approved_feature_version.transform(asset_window)
        signal = approved_model.predict(features)
        if review_policy.requires_attention(signal, asset_window.mode):
            upsert_review_task(asset_window.asset_id,
                               asset_window.cutoff_time,
                               model_version=approved_model.version,
                               evidence=signal)
# Technician findings are recorded separately for later evaluated retraining.
The upsert key should prevent repeated readings from opening duplicate work orders. An alert needs a supporting trend, data-quality status, model version and a clear owner. Define expiry and re-evaluation rules so a stale alert is not acted on after a repair. Keep the actual machine-control and safety authorization path separate from this advisory workflow.
Evaluation without time or asset leakage
Create splits before generating overlapping windows. Neighboring windows from the same run can be nearly identical; randomly placing them in both training and test sets inflates results. Use chronological holdouts for future operation and asset-level holdouts where the model must generalize to new machines. Keep feature selection, normalization and threshold tuning inside the training or validation process.
| Task | Useful metrics | Operational check |
|---|---|---|
| Anomaly triage | False alerts per asset-month; reviewed anomaly relevance | Can engineers inspect the volume? |
| Failure risk | PR-AUC, recall at a chosen alert budget, calibration | Is warning lead time sufficient? |
| RUL | MAE by life stage; uncertainty coverage | Does error change the maintenance decision? |
| Whole workflow | Verified useful interventions and missed events | Are downtime and maintenance consequences acceptable? |
Report performance by failure mode, site, asset age and operating regime where data permits. Rare-event metrics need uncertainty and an honest count of observed failures. Test against the existing policy over a comparable exposure window. Do not claim that every alert prevented a failure: the counterfactual is generally unobserved. A controlled rollout or carefully designed operational evaluation is stronger evidence than a model leaderboard score.
Six industry applications
| Industry | Illustrative asset and signal | Practical output |
|---|---|---|
| Manufacturing | Motor vibration and load | Reviewed bearing inspection task |
| Energy | Pump pressure, temperature and service history | Prioritized maintenance investigation |
| Logistics | Fleet component telemetry and usage | Workshop planning recommendation |
| Utilities | Transformer condition and operating context | Specialist assessment queue |
| Buildings | HVAC current, temperature and demand | Service triage with tenant constraints |
| Process industries | Compressor trends and production modes | Maintenance window scenario |
Each application needs its own data and safety assessment. An approach that works for similar motors in a stable factory may not transfer to a heterogeneous fleet. Site connectivity, environmental conditions and maintenance practices change the problem. Use the industry examples to frame discovery questions, not as claims that a generic model is already validated for every asset.
Five-phase implementation roadmap
- Discovery: choose a failure mode, maintenance owner and actionable warning horizon. Accept a documented baseline and intervention policy.
- Data readiness: reconcile asset identity, telemetry and maintenance labels. Accept quality reports and a reproducible historical dataset.
- Offline proof: compare simple and candidate models with leakage-safe splits. Accept operating metrics and documented limitations.
- Shadow pilot: score without changing control behavior; let engineers inspect signals. Accept evidence of manageable alert workload and useful lead time.
- Controlled operations: integrate approved CMMS tasks, monitoring and rollback. Expand only after service and maintenance owners approve the results.
Cost and ROI: distinguish capacity from avoided downtime
Include sensors, gateways, connectivity, integration, storage, feature processing, model operations, engineer review and maintenance changes. Existing instrumentation may reduce setup cost but not necessarily data preparation. Spares availability and production scheduling affect whether an early signal creates value. Some high-consequence assets justify monitoring for risk management even without a short financial payback.
Hypothetical annual scenario: 120,000 currency units of conservatively assessed avoided disruption plus 30,000 of distinct inspection efficiency, less 70,000 recurring cost, gives 80,000 annual net value. A 160,000 initial investment has a two-year simple payback under those assumptions. If only half the assumed disruption benefit is realized, net value falls to 20,000 and payback becomes eight years. The calculation is illustrative; avoided failures must not be inferred simply by multiplying alert count by maximum downtime cost.
Avoid double counting the same lost production as both downtime and revenue loss unless the accounting treatment genuinely separates them. Track actual maintenance actions, confirmed findings, production effects and total review effort. The business case should remain credible under lower event frequency, increased false alerts and higher support cost.
Frequently asked questions
What is predictive maintenance using machine learning?
It uses historical and current operational data to estimate developing equipment problems and support maintenance decisions. The useful output is an actionable, reviewed signal tied to a defined asset and failure mode. It is not simply a dashboard, and it does not replace mandatory inspections or safety systems.
Is anomaly detection enough?
Sometimes it is a useful starting point, but an unusual reading does not prove a failure is developing. Operating modes, sensor faults and environmental changes can all create anomalies. Engineers need context, supporting evidence and a manageable review process before changing maintenance actions.
How much failure data is needed?
There is no universal number. Requirements depend on the failure mode, model and desired generalization. Rare or poorly labeled failures can limit supervised learning. Begin with a data audit, simple baselines and explicit uncertainty rather than assuming a more complex model will compensate for missing evidence.
Which model is best?
Choose by task and data. Boosted trees are useful candidates for engineered tabular features; anomaly methods can model normal behavior; survival models address time-to-event questions. Sequence networks need suitable temporal data. Compare candidates against a simple baseline using operating measures, not reputation.
What is remaining useful life?
RUL is an estimate of time or usage until a defined endpoint under specified conditions. It requires suitable degradation or event evidence and should include uncertainty. A point estimate is not a guarantee, and changes in load or maintenance can invalidate the original assumptions.
Can the model shut down a machine automatically?
This advisory architecture does not authorize autonomous shutdown. Safety-critical actions require a separately engineered, assessed and approved control pathway. Preserve existing safety interlocks and operator authority. A prediction service should not be inserted into a safety function merely because it can call an API.
How do we avoid data leakage?
Split by time and, where appropriate, asset before creating overlapping windows. Fit preprocessing only on training data and exclude features unavailable at prediction time. Verify that work-order outcomes, future sensor values and post-failure maintenance information cannot enter the features.
Does every project need streaming inference?
No. Daily or hourly scoring may be sufficient if degradation and maintenance decisions evolve slowly. Real-time ingestion adds operational complexity. Match the scoring interval to the warning horizon and available response process, then verify that delayed or missing data is handled safely.
How should maintenance alerts be measured?
Track false alerts per asset and exposure period, verified findings, useful warning lead time and missed events. Include engineer review time and whether the recommended intervention was feasible. Model accuracy alone cannot show that the maintenance workflow improved.
When should the model be retrained?
Investigate changes in operating regimes, equipment, sensors, data quality and outcomes. Retraining is one possible response, not an automatic fix. Evaluate the new model on independent data, approve it through change control and retain the previous version for rollback.
Technical references
- Fabric predictive maintenance architecture
- AWS predictive maintenance with SAP solution documentation
Technical source review: 1 November 2026. Illustrative architectures, assumptions and examples are not client implementations or measured production results. Deployment-specific verification is required.