
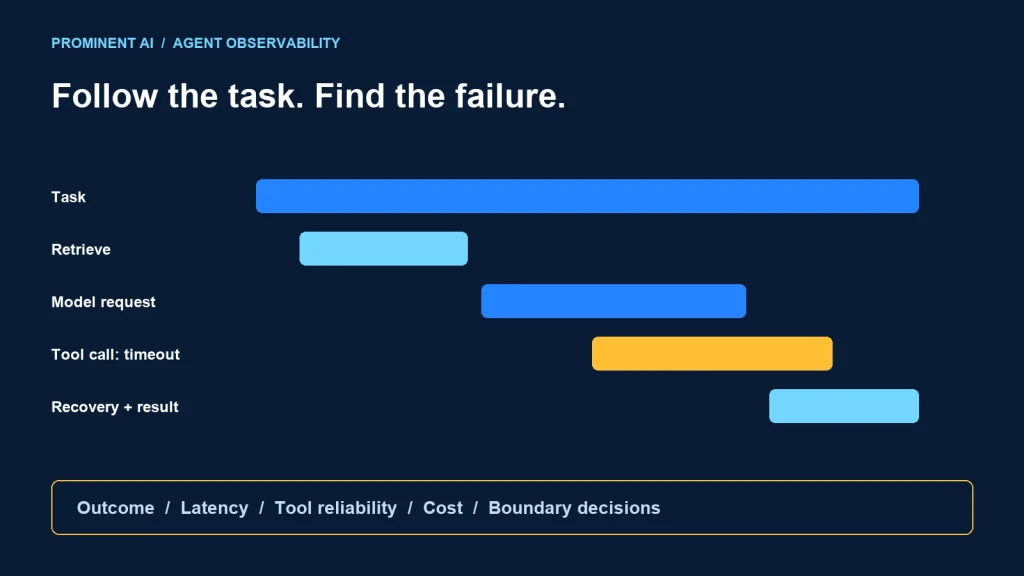
AI agent observability connects a user task to the model requests, tool calls, permission decisions and workflow outcomes that produced its result. Record a trace across that path, measure reliability and cost at the task level, and preserve enough evidence to investigate failures without copying secrets or unnecessary personal data into telemetry.
A fast model response is not proof that the task succeeded. A tool can return a successful HTTP status while the application produces an unsupported answer. Conversely, an access denial can be the correct outcome. This guide proposes a practical tracing taxonomy, example event fields, reliability definitions and a troubleshooting playbook for an enterprise assistant.
What should you monitor first?
- Whether an eligible task reached a correct, supported outcome.
- Which model and tool steps contributed to latency and consumption.
- Whether permissions, approvals and execution limits were enforced.
- Which failures are transient, deterministic or uncertain after a side effect.
- Whether telemetry itself exposes data or loses important request context.
Trace one task across its actual execution path
A trace groups related operations; spans describe timed work within that path. OpenTelemetry’s trace documentation explains the underlying concepts. For an agent application, choose boundaries that reveal the task’s behavior instead of recording only the final model request.
In the proposed incident assistant, a root task span links request validation, routing, retrieval, model calls, tool execution and answer validation. A resumed approval workflow also retains a stable application workflow identifier across separate execution traces. Waiting for a reviewer should be distinguishable from active compute time.
| Span or event | Purpose | Useful safe metadata |
|---|---|---|
| Task | Track the user-visible unit of work | Workflow ID, application release, task type, final outcome |
| Route | Explain handler selection | Route version, selected handler, fallback outcome |
| Retrieve | Inspect evidence gathering | Source class, permitted result count, freshness outcome |
| Model request | Measure inference work | Provider/model reference, usage counts, duration, outcome |
| Tool call | Inspect business operation attempts | Tool and contract version, authorization outcome, attempt number |
| Approval | Track review boundaries | Proposal reference, decision state, queue duration |
| Validation | Record response or execution checks | Check version, supported/unsupported result, escalation reason |
Use existing instrumentation where it captures the required provider or HTTP activity. Add application spans for business meaning that automatic instrumentation cannot infer. Review the current OpenTelemetry generative AI conventions before choosing standardized attribute names; pin the instrumentation and convention versions used by the application.
An illustrative structured event
The following uses application-specific field names. It is a proposed event contract, not an OpenTelemetry configuration file or a real production trace.
{
  "event": "tool_attempt_completed",
  "workflow_id": "wf-demo-001",
  "trace_id": "example-trace-reference",
  "tool": "get_ticket_summary",
  "tool_version": "1",
  "attempt": 1,
  "authorization": "allowed",
  "outcome": "upstream_timeout",
  "duration_ms": 800,
  "retryable": true,
  "contains_raw_content": false
}
A retryable flag must reflect operation semantics and policy, not merely an error label. A read-only timeout and a timeout after submitting a consequential write require different recovery behavior.
Separate failures from correct boundary decisions
Do not collapse every non-answer into “agent error.” Classify the event so the responsible team can act. A valid denial of access is evidence that a control worked, while an unauthorized disclosure is a security failure even if the model produced fluent text.
| Outcome class | Example | Expected handling |
|---|---|---|
| Validation rejection | Invalid ticket identifier | Correct the input or clarify; do not repeatedly retry unchanged data |
| Expected policy denial | Caller cannot access the record | Stop at the boundary and explain the limited outcome |
| Upstream transient failure | A permitted read times out | Apply bounded recovery if safe |
| Contract failure | Tool returns a malformed response | Fail validation and route to the service owner |
| Quality failure | Answer contradicts retrieved evidence | Withhold or correct the unsupported answer; investigate context and evaluation |
| Budget stop | Delegation limit is reached | Return a defined partial outcome or escalate |
| Uncertain execution | A write may have succeeded before a timeout | Reconcile with the authoritative system before retrying |
Preserve both the technical error and the application outcome. An upstream timeout may be recovered successfully; its task should still reveal the extra attempt and latency. A completed task with an inappropriate permission bypass must never be counted as a successful recovery.
Define reliability at the task level
Choose an eligible task set and an explicit success definition. For a read-only status assistant, a possible criterion is a permitted, source-supported answer within the agreed active-processing deadline. The business owner must agree what counts as unsupported, incomplete or correctly declined.
Task success rate =
  eligible tasks meeting the defined success criteria
  / eligible tasks evaluated

Cost per successful task =
  accounted cost for the measured task set
  / successfully completed tasks in that set
For illustration only, if 950 of 1,000 eligible evaluated tasks satisfy the agreed criteria, the success rate is 95%. If their measured total accounted cost is 50 currency units, cost per successful task is about 0.0526 units. These figures demonstrate arithmetic; they are not a Prominent benchmark or a vendor performance claim.
Useful dashboard groups
- Outcome: supported completion, correct denial, clarification, escalation and unsupported answer.
- Latency: end-to-end and critical-path duration, with active work separated from human waiting.
- Tool reliability: attempts, failures, contract violations and recovered failures by tool version.
- Consumption: model usage, retry consumption and total calls per task.
- Boundary behavior: rejected unauthorized requests and any confirmed boundary violations.
- Quality: evaluation results and reviewed production samples tied to application releases.
Use percentile latency alongside counts and sample size. An average can hide a slow minority of tasks. Define a service-level objective only after understanding the workflow and baseline. Targets such as an arbitrary universal “two-second agent” can be misleading when some tasks include slow upstream systems or human decisions.
Estimate cost without confusing estimates and billing
Capture available usage information for every relevant model request, including retries. Apply a versioned rate table that reflects the actual model and usage categories, and mark incomplete usage explicitly. Do not assume cached input, ordinary input and output all have the same rate.
Model charges are one component. Hosting, retrieval, business APIs, data transfer, telemetry storage and operational review can matter too. Reconcile estimates against the billing source at an appropriate aggregation level. A sampled trace set is not automatically a complete cost ledger.
For an expensive task, inspect repeated context, repeated retrieval and unnecessary delegation before changing models. A cheaper individual call can produce a more expensive task if it requires many retries or human repair. For coordination choices, see multi-agent orchestration patterns.
Keep telemetry useful without collecting everything
Prefer operation names, outcomes, counts and controlled references where raw content is unnecessary. Prompts, tool results and exception messages can contain credentials or sensitive business information. Review collection before data reaches the telemetry backend rather than relying only on later dashboard permissions.
High-cardinality values such as raw user messages, record identifiers and request URLs can also make metrics expensive and difficult to aggregate. Keep bounded labels in metrics and use controlled trace references for detailed investigations. Apply access rules and retention policies to the diagnostic store itself.
If production content sampling is required for quality evaluation, define the approved scope, redaction and access path. Keep that governed dataset distinct from unrestricted application logs. Do not label a pipeline privacy-safe merely because one field is hashed; other fields may still identify people or reveal confidential content.
A troubleshooting playbook for common symptoms
Latency increases but model duration is stable
Inspect queue time, repeated retrieval, upstream API spans and additional delegation. Compare the critical path with the last known release. If parallel work was added, check whether concurrency limits moved the delay into a queue.
Tool failures spike after a deployment
Group failures by tool contract and application version. Check argument validation, response schema changes and upstream permissions. Avoid hiding a deterministic contract error with repeated retries.
Task cost rises without more requests
Inspect usage per call, duplicated conversation context and rate-table changes. Confirm that billing categories and estimated usage remain comparable. Check whether a changed prompt expanded every request.
Fluent answers become less reliable
Review retrieval freshness, source permissions, evaluation cases and answer validation. Trace a failing task from original evidence to the final response. A successful model API call is not a quality test.
A write times out
Use its workflow and operation references to check the authoritative business service. Follow the reconciliation path rather than issue an unrestricted duplicate. For approval and execution evidence, see human-in-the-loop AI workflows.
Observability rollout checklist
- Agree the task unit, eligible population and outcome definitions.
- Propagate trace context across the application, tool adapters and supported upstream calls.
- Add versioned business events for authorization, approval and completion.
- Verify that secrets and unnecessary raw content are excluded.
- Generate known validation, timeout, denial and contract failures in a controlled test environment.
- Check that dashboards and alerts distinguish those outcomes.
- Assign an owner and response procedure to each alert.
- Test whether a reviewer can reconstruct one failed task from its references.
Common questions about AI agent observability
How do you monitor failures and cost in AI agents?
Should every prompt and tool result be logged?
Is a denied tool call an agent failure?
Can sampled traces calculate the complete bill?
Which reliability target should an agent use?
Make agent behavior diagnosable before expanding it
Discuss an AI agent integration assessment with Prominent AI Services LLP. Start with the task outcomes, failure scenarios and operational evidence your team needs.
Technical references reviewed 2 November 2026. Event fields, metrics and figures are illustrative design examples, not measured client results.