
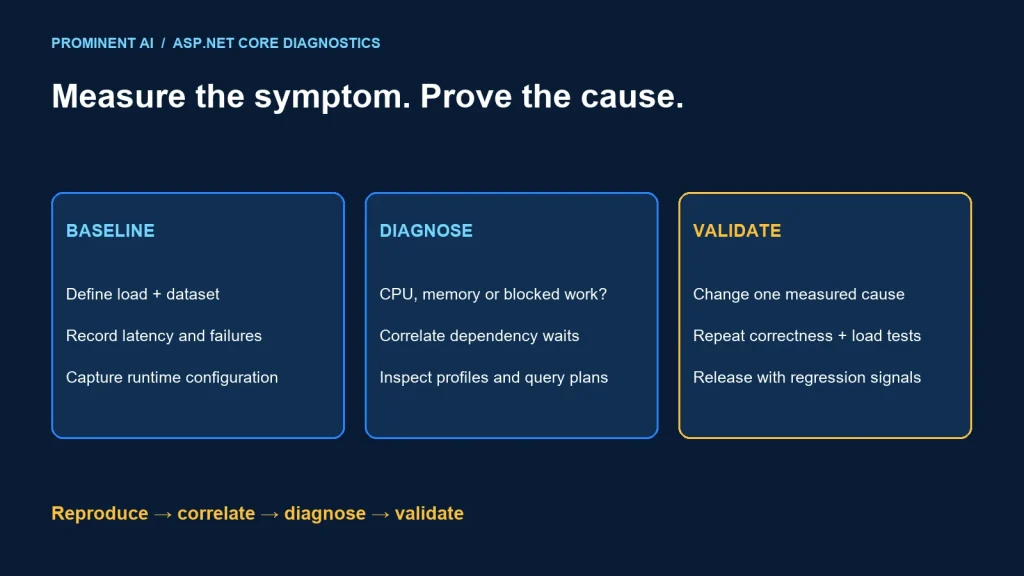
Find ASP.NET Core performance bottlenecks by reproducing a defined workload, correlating request latency with runtime and dependency signals, and changing one measured cause at a time. High memory, slow requests and busy threads are symptoms rather than diagnoses. Separate CPU work, allocation and retention, blocked execution and database waits before choosing a fix.
Key takeaways
- Record throughput, latency distribution, failures and workload shape together.
- Distinguish allocation pressure from retained memory.
- Async syntax does not make CPU work cheaper or remove dependency limits.
- Verify SQL behavior and round trips before tuning garbage collection.
ASP.NET Core performance optimization starts with a baseline
Define the business journey and service objective. Specify request mix, arrival pattern, concurrency, payload size, dataset shape and dependency behavior. Include warm-up and a stable measurement window. Keep cold-start behavior as a separate test where it matters.
Record runtime and SDK versions, OS, container limits, CPU and memory allocation, database tier and configuration. Keep the same inputs when comparing candidates. A test with an empty database or disabled authorization may not represent production.
Measure p50, p95 and p99 latency alongside request count and error rate. A lower average can conceal worse tail behavior or more rejected requests. Report the offered load as well as completed throughput so an overloaded system does not appear faster merely because it dropped work.
Use authorized test environments for sustained load. Set stop conditions for resource exhaustion or dependency impact. This article supplies a diagnostic method and fictional logs; it does not claim a production benchmark was executed.
Choose evidence from the symptom
| Observed symptom | Candidate explanation | Evidence to collect |
|---|---|---|
| High CPU with slow requests | Expensive computation, serialization or repeated work | CPU profile and request correlation |
| Growing managed heap after similar workloads | Retained objects or unbounded cache | Comparable heap evidence and root paths |
| High allocation and frequent collection | Large temporary objects or excessive materialization | Allocation profile and payload/query behavior |
| Long latency with queued thread-pool work | Blocking or thread-pool starvation | Runtime signals and thread stacks |
| Low application CPU with slow dependency spans | Database, connection pool or remote service wait | Dependency traces and server-side evidence |
Microsoft’s dotnet-counters documentation presents the tool as first-level monitoring before deeper investigation. Use runtime metrics to narrow a hypothesis, then obtain the profile, stacks or dependency evidence that can distinguish competing explanations.
# Illustrative command templates: replace 1234 with the authorized process ID.
# Requires a compatible, approved dotnet-counters installation.
dotnet-counters monitor --process-id 1234
dotnet-counters collect --process-id 1234 --format json --output counters.json
Commands above were checked against the documented interface, but no counters capture is claimed for this article. Verify the installed tool version, supported runtime, permissions and container diagnostic access before running them.
Memory, allocation and garbage collection
Separate process memory from managed heap size. Native allocations, thread stacks, mapped files and other runtime resources can contribute to process usage. A stable managed heap does not prove every source of memory is stable.
For suspected retention, compare equivalent points in repeated workload cycles and investigate why relevant objects remain reachable. A cache that intentionally retains a bounded dataset differs from a collection that grows with every request.
For allocation pressure, inspect the hot path for repeated large buffers, full result-set materialization, unnecessary object graphs and serialization copies. Reduce avoidable work before introducing pooling or changing runtime settings. Pools themselves need size limits and correct lifecycle handling.
Microsoft’s heap-tool guidance notes that collecting a GC dump triggers a full collection and can suspend a process for a long time on a large heap. Plan collection with operational owners, and treat diagnostic artifacts as potentially sensitive.
Do not force garbage collection as a general latency repair. Changing GC mode or memory limits without understanding the workload can trade one failure mode for another. Test any justified configuration change with the same workload and monitor both tail latency and resource behavior.
Async bottlenecks and thread-pool starvation
Microsoft’s starvation diagnostic guide uses runtime counters and stack or trace evidence to investigate unavailable worker threads. Follow a similar evidence chain rather than diagnosing starvation from latency alone.
Inspect synchronous waits on asynchronous work, blocking I/O and locks held across slow operations. A method returning Task can still block internally. Replacing a wait with genuine asynchronous I/O helps only if the entire relevant path supports it.
Avoid treating Task.Run as a universal web-request fix. CPU-bound work still consumes CPU, and unbounded fan-out can overload the database or remote API. Apply bounded concurrency, cancellation and timeouts according to dependency capacity.
Check connection pools and external throttling. If requests spend most of their time waiting for a saturated dependency, adding application threads or replicas may increase contention. Confirm where time is spent before scaling.
For background jobs, measure queue age and completion rate. Returning HTTP quickly after enqueueing work can improve perceived response time while leaving a growing processing backlog. The business objective must include eventual completion.
SQL and Entity Framework Core bottlenecks
EF Core’s efficient-querying guidance recommends examining query plans, selecting needed properties and bounding result sizes. Index design must account for both read benefit and write overhead.
Correlate slow request traces with actual query count, duration and rows returned. Look for repeated per-record queries, unnecessary columns and large results. Compare application timing with database execution and connection acquisition to avoid confusing server work with network or pool waits.
Test indexes and pagination against representative data distributions. A query fast for a small tenant may scan a much larger slice for another. Record parameter values safely or use protected reproductions; do not expose sensitive payloads in logs.
Use no-tracking query behavior only where the operation’s semantics permit it. Reducing tracking is not a substitute for a correct query plan or sensible result size. Verify provider-generated SQL and the complete transaction behavior after changes.
Review lock waits and transaction duration for write-heavy paths. A slow external call inside a transaction can extend contention beyond its own request. Rework boundaries carefully while preserving required consistency.
Fictional investigation log examples
The following normalized records illustrate reasoning, not actual runtime output or measured results. Field names are application-defined; they are not promised dotnet-counters instrument names.
case=orders-list release=baseline route=/orders
observation=slow-tail app_cpu=low dependency=sql
query_count_per_request=high result_size=unbounded
next_action=inspect-query-shape-and-plan

case=report-export release=baseline route=/exports
observation=memory-growth retained_object=export-buffer-cache
next_action=check-cache-bound-and-object-roots

case=partner-status release=baseline route=/status
observation=queued-work blocking_stack=sync-wait
next_action=validate-async-path-and-dependency-capacity
Each record states a hypothesis and the next discriminating check. It does not jump directly from symptom to a configuration tweak. Replace the qualitative observations with real measurements in your investigation record.
For an A/B comparison, preserve inputs, perform repeated runs and report variability. Confirm correctness and error rates alongside latency. If multiple changes are bundled, do not attribute the entire difference to one adjustment.
A repeatable diagnostic runbook
- Define the user-visible problem and expected service objective.
- Capture deployment, runtime and workload configuration.
- Reproduce under a bounded, representative load.
- Correlate request traces with runtime and dependency signals.
- Collect focused deeper evidence for one hypothesis.
- Implement the smallest relevant change.
- Repeat the same workload and correctness checks.
- Release gradually and monitor for regression.
Evidence to keep with the change
- Before and after configuration with exact versions.
- Workload input, dataset assumptions and measurement window.
- Latency distributions, throughput, failures and resource usage.
- Profiles or query plans supporting the diagnosis.
- Correctness tests and known limitations.
- Rollback or recovery procedure and monitoring owner.
Keep runtime upgrade effects separate through the .NET upgrade planning guide. For pooled SaaS workloads, include tenant isolation and contention in the test design.
Common questions
How can you find performance bottlenecks in ASP.NET Core?
Reproduce a defined workload, correlate slow requests with runtime and dependency signals, then use profiles, stacks or query evidence to test a specific hypothesis.
Does high memory mean a .NET memory leak?
No. Distinguish managed retention, temporary allocation, native memory and expected caches. Compare equivalent workload states and inspect ownership.
Does async always improve performance?
No. Genuine asynchronous I/O can avoid blocking, but CPU cost, bounded capacity and dependency contention remain.
Should we tune GC before SQL?
Follow evidence. If dependency waits and query behavior dominate, GC changes may not address the cause. Investigate the bottleneck shown by correlated measurements.
Can profiling affect production?
Yes. Tool overhead and artifact sensitivity vary. Plan authorized collection, choose focused evidence and assess operational impact before capture.
Find the bottleneck before changing the platform
Bring slow journeys, workload traces and current runtime details. Discuss your .NET modernization roadmap to define a reproducible performance investigation and controlled improvement plan.