
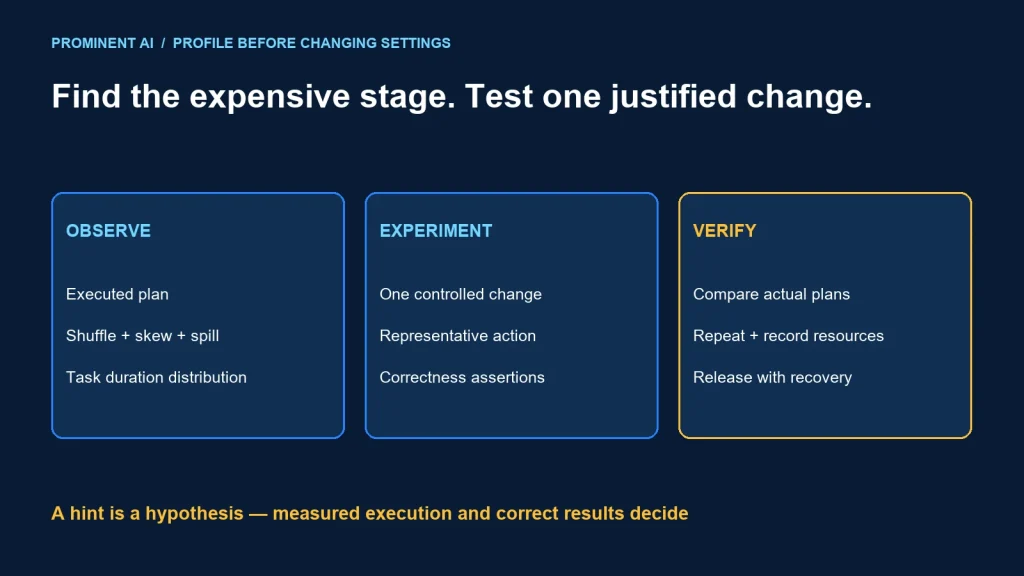
Improve slow PySpark jobs by locating the expensive stage, checking its execution plan and testing one justified change at a time. Partition counts, join hints and larger clusters are tools, not universal fixes. Preserve correct outputs and measure the action that actually executes the job.
Key takeaways
- Inspect scans, shuffle, skew, spill and task duration before changing settings.
- Separate storage partitioning, execution partitions and output-file layout.
- Broadcast only when the build-side size and executor resources justify it.
- Use AQE as part of the plan, then verify the final executed behavior.
Start from an observed bottleneck
Capture the job’s business contract and input revision. Identify which action triggers the work and how completion is measured. Timing a lazy DataFrame transformation without an action does not measure the query’s execution.
Inspect the SQL plan and stage metrics in the supported Spark interface. Compare task durations, input sizes, shuffle volumes, spill and failures. A small number of very slow tasks suggests a different investigation from thousands of short tasks dominated by scheduling overhead.
| Observation | Investigation | Possible experiment |
|---|---|---|
| Large unnecessary scan | Selected columns and early filters | Reduce input while preserving results |
| Long-tail tasks | Key distribution and partition sizes | Address the demonstrated skew |
| Heavy shuffle | Join and aggregation plan | Compare a justified join strategy |
| Spill or memory failures | Per-task data and executor pressure | Change workload shape or resources |
| Many tiny outputs | Write partition layout | Test an appropriate output-file strategy |
Keep the experiment connected to the observation. Changing several settings simultaneously makes it difficult to explain an improvement or a regression.
Partitioning, shuffle, joins and AQE
Storage partitioning helps organize persisted data. Execution partitions determine how work is distributed. Output partition choices affect the files produced. Treat these as related but different decisions; an arbitrary repartition can introduce extra movement rather than remove it.
The Spark 3.5.6 performance guide documents shuffle settings, join hints and Adaptive Query Execution. AQE uses runtime statistics and can adjust supported shuffle and join behavior. Join hints are not guaranteed for every join type. Match guidance to your actual runtime and inspect the final executed plan.
For skew, examine the key distribution before adding salting or other complexity. A dominant key, many nulls or duplicated dimension keys can produce very different problems. An unexpectedly large join output may be a data-quality error rather than a partition-count problem.
A synthetic comparison lab with correctness assertions
The script below is intended for spark-submit in a compatible, approved Spark environment. Local validation checked Python syntax only: this authoring computer does not have PySpark, so no Spark timing or speedup is claimed. The fixture is small and synthetic; it demonstrates a measurement pattern, not a production sizing recommendation.
It compares the optimizer’s baseline with an explicit broadcast hint. The baseline may already choose broadcast, so identical plans or no improvement are valid outcomes. The configured partition count is a lab value, not a recommended production default.
"""Run with spark-submit in a compatible, approved Spark environment.
Synthetic fixture only. Local authoring validation was syntax-only, not a Spark run.
"""
from time import perf_counter
from pyspark.sql import SparkSession, functions as F

spark = SparkSession.builder.appName('tuning-comparison').getOrCreate()
spark.conf.set('spark.sql.adaptive.enabled', 'true')
spark.conf.set('spark.sql.shuffle.partitions', '16')

facts = (spark.range(100_000)
         .withColumn('key', F.when(F.col('id') < 80_000, F.lit(0))
                     .otherwise(F.col('id') % 100))
         .withColumn('amount', F.lit(1)))
dim = spark.range(100).select(F.col('id').alias('key'))

def query(broadcast_dimension=False):
    right = F.broadcast(dim) if broadcast_dimension else dim
    return facts.join(right, 'key').groupBy('key').agg(F.sum('amount').alias('total'))

def measured(label, frame):
    frame.explain(mode='formatted')
    start = perf_counter()
    rows = frame.collect()  # bounded to 100 aggregate keys in this fixture
    elapsed = perf_counter() - start
    assert len(rows) == 100
    assert sum(row['total'] for row in rows) == 100_000
    print({'label': label, 'seconds': elapsed, 'rows': len(rows)})

# A warm-up and alternating order reduce some first-run/order bias;
# this is not a controlled cold-cache or production benchmark.
query().collect()
for label, use_broadcast in [('baseline_1', False), ('hint_1', True),
                             ('hint_2', True), ('baseline_2', False)]:
    measured(label, query(use_broadcast))
spark.stop()
The assertions check 100 aggregate keys and a total of 100,000 unit-valued facts. Those conditions verify this fixture’s output shape and total, not arbitrary production join correctness. Add tests for unmatched keys, duplicates in the dimension, nulls and the actual join type before adapting the pattern.
Read plans and metrics alongside elapsed time
Save the formatted plan and inspect the execution UI after the action. Record whether the baseline and hinted candidates actually used different join strategies. If the plans are effectively the same, do not attribute timing variation to a strategy change that never occurred.
Alternate run order and repeat enough times to understand variation. Distinguish warm-up, repeated execution and genuinely controlled cold conditions. The script’s warm-up does not clear all caches or isolate the cluster from other work.
| Candidate | Actual plan | Time and stage metrics | Correctness |
|---|---|---|---|
| Baseline | Record executed strategy | Measure, including failures | Run fixture and workload tests |
| One targeted change | Confirm intended difference | Repeat under comparable conditions | Compare accepted outputs |
| Production-like workload | Record runtime and data revision | Measure concurrency and resource use | Reconcile business results |
This is a worksheet, not benchmark results. Preserve the runtime version, executor configuration, data sizes and background load with any values you publish.
Cluster trade-offs and release checks
A larger cluster can reduce some workloads’ runtime while increasing cost or leaving a skewed task as the bottleneck. Compare cost per accepted completed job, including startup, failed attempts and retries. Do not assume twice the resources means half the runtime.
Be cautious with caching. Use it when repeated work justifies memory use, and measure the complete lifecycle including materialization and cleanup. A one-off query can become slower if caching adds work without reuse.
- Confirm the output contract and representative input revision.
- Record the observed bottleneck and proposed change.
- Check the actual execution plan after the action.
- Compare output correctness, latency and resource use.
- Test failure and retry behavior before release.
- Keep the previous approved configuration available.
For change-heavy ingestion, use the CDC guide. For persisted tables, review the open table format comparison. Query tuning cannot compensate for an incorrect data or recovery contract.
Common questions
How do I improve a slow PySpark job?
Find the expensive executed stage, inspect its plan and metrics, then test one justified change with correctness checks and representative data.
Should I always increase shuffle partitions?
No. Too few can overload tasks; too many can add overhead. Use workload evidence and runtime behavior rather than a universal count.
Is a broadcast join always faster?
No. Size, join support, memory and the existing plan matter. The optimizer may already select broadcast without a hint.
Does AQE remove the need for profiling?
No. Verify the final behavior and investigate skew, spills, scans and correctness. Adaptive planning does not establish a universal optimum.
Are timings provided for the tutorial script?
No. The script was syntax-checked locally but not executed in Spark. Run it in a compatible test environment and retain the measured conditions.
Turn tuning into an evidence-based experiment
Bring the slow stage, execution plan and workload contract to a review. Request a data engineering pipeline assessment to identify and validate targeted performance changes.